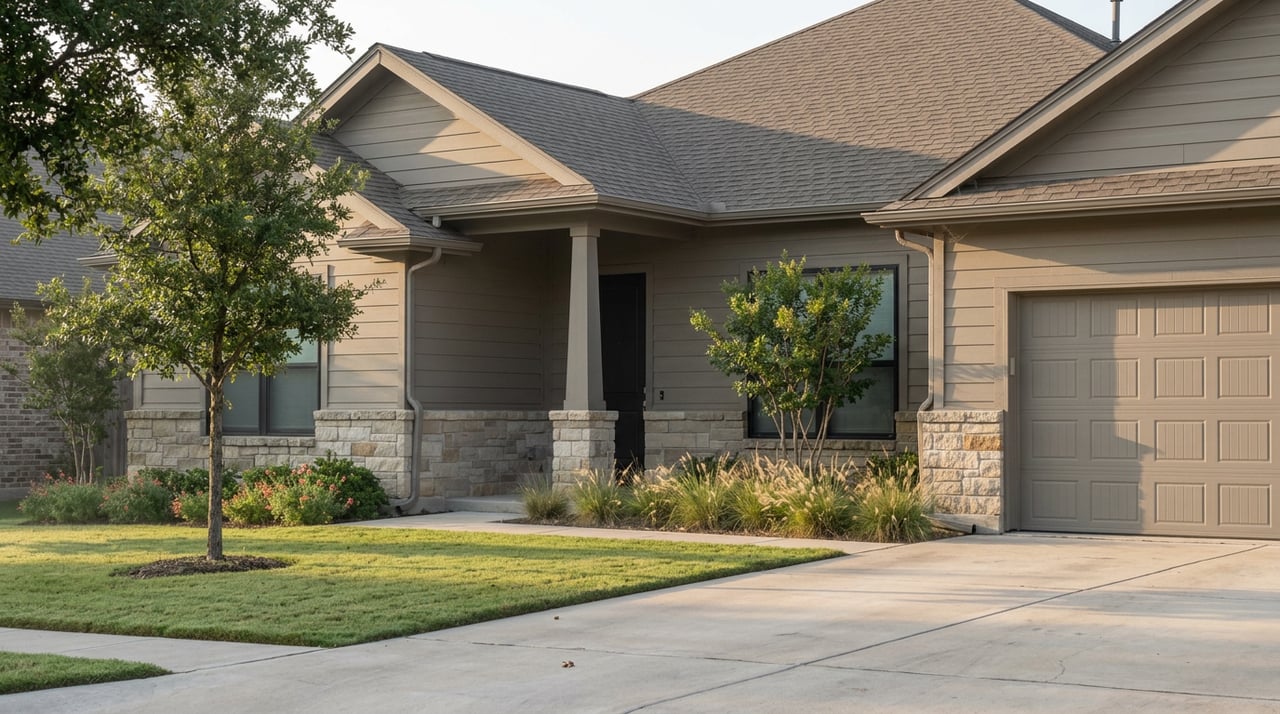
Picture two buyers, both eyeing homes priced within a few thousand dollars of each other, both twelve miles apart on the same stretch of I-35 between San Antonio and Austin. Both homes may look like the same proposition: a growth corridor, easy highway access, room to run. Yet one buyer could face a property tax bill that runs thousands of dollars a year higher than the other, for a similarly priced house on a highway that won't be finished for at least another year in either direction.
That's the problem with treating the I-35 corridor as a single market. It isn't one. It's a stretch of interstate that cuts through Bexar, Guadalupe, Comal, and Hays counties, each with its own tax rate, its own construction timeline, and right now, at least one submarket in the middle of a price correction while its neighbors hold steady. The corridor comparison charts flatten all of that into a single number. The real decision buyers are making is narrower and more specific than "do I want I-35 access." It's which county's tax bill, which construction phase, and which submarket's supply pipeline you're actually buying into.
The Highway Isn't Finished. Not Even Close.
TxDOT's I-35 Northeast Expansion program covers roughly 20 miles of highway from N. Walters Street to FM 1103, running through northeast San Antonio, Live Oak, Selma, and Schertz. It's split into pieces with very different clocks. The Central segment, which connects to Loop 410 North and Loop 1604 West, has been under construction since June 2022 and isn't expected to wrap until late 2027. The South Phase 2 segment started construction in January 2026 and was still only about 15 percent complete as of mid-2026. South Phase 3, near Loop 410 and FM 78, started in March 2025 and sat around 43 percent complete at the same point. The North segment, running from FM 3009 to FM 1103, hasn't broken ground yet. It's funded in the state's ten-year plan, which is a different thing than a start date.
Buy a home along this stretch today and you are not buying into a finished highway. You're buying into a multi-year construction site with a payoff that arrives on a schedule measured in phases, not seasons. That matters for a buyer weighing a $20,000 premium for a lot closer to a future interchange, because the interchange in question may still be two or three years from carrying traffic the way the renderings show it.
The corridor's growing pains are big enough that a new coalition formed specifically to coordinate a response. The Central Texas Alliance launched in July 2026, co-chaired by Gary Farmer and Jenna Saucedo-Herrera and backed by Henry Cisneros, with I-35 congestion named as one of its first work streams alongside housing, water, and workforce development. The group's existence is itself a data point. Nobody forms a 120-city, 13-county alliance to fix a problem that's nearly solved.
What the County Line Actually Costs You
Here's the part most corridor comparisons skip entirely: property taxes shift the moment you cross a county line, and that shift compounds every year you own the home.
| County | Where it applies along the corridor | Approximate effective property tax rate |
|---|---|---|
| Comal | New Braunfels, parts of Selma | Roughly 1.2% to 1.85%, depending on the source and the specific taxing entities layered on top |
| Hays | San Marcos, Kyle | Roughly 1.8% to 2.2% |
| Bexar / Guadalupe | Northeast San Antonio, Schertz, Cibolo, Universal City | Generally between the two, varying by school district and MUD |
Estimates of Comal County's exact rate vary depending on which source you check, but nearly every comparison places it below Hays County's range. On a $350,000 home, the difference between the two counties can run $2,100 to $3,500 a year, which stacks up to somewhere between $21,000 and $35,000 over a ten-year hold. That's not tax advice, and it's not a fixed rule, since municipal utility districts and public improvement districts stack their own assessments on top of the base county rate and those vary block by block, sometimes subdivision by subdivision. It's a comparison worth running before you write an offer, not after.
Selma is a good illustration of how granular this gets. The city's limits actually touch three counties, Bexar, Comal, and Guadalupe, which is part of why a buyer can tour two homes in the same subdivision and find one zoned to Schertz-Cibolo-Universal City ISD and the other to Judson ISD, with different tax implications attached to each. The county line isn't a clean edge on the corridor. It's a line that sometimes runs through a neighborhood.
Price Trends Vary Along the Corridor
The corridor's growth story is real. It's also not uniform, and the unevenness tells you something the aggregate numbers don't.
San Marcos, on the Hays County end of the corridor, has been in an active price correction. Median sale prices there ran close to $365,000 at their 2025 peak and had fallen to somewhere around $303,500 to $320,000 in early 2026, a decline of roughly 12 to 17 percent. Selma, on the other end near San Antonio, has held closer to steady, with median prices sitting in the low-to-mid $300,000s through 2026. New Braunfels sits in between and spreads wide depending on where you look, with newer I-35-adjacent subdivisions starting near $280,000 and Gruene-area homes pushing past $600,000. Redfin's most recent window, the three months ending June 2026, put New Braunfels' median sale price at $349,000, up about 1.1 percent year over year, with homes taking around 69 days to sell.
The correction in San Marcos isn't a signal that the area is losing appeal. It's a supply story. The San Marcos and Kyle submarket absorbed the bulk of new apartment and home construction along the corridor in 2025, taking in roughly 2,015 of the 2,925 total units delivered corridor-wide in the first seven months of that year, according to Yardi Matrix data reported by Multi-Housing News. That's a lot of new inventory landing in one submarket at once, and it's a big part of why rents there, averaging around $1,598 as of mid-2025, ran higher than the rest of the corridor while resale prices simultaneously softened. Compare that to Universal City, where rents averaged closer to $1,104 over the same window, well below the national benchmark of $1,786. Same corridor, same highway, two very different supply-and-demand stories playing out at the same time.
What's Actually Under Construction Right Now
The corridor isn't standing still while the highway catches up. A few concrete projects worth knowing if you're evaluating specific stretches:
- Kyle Park, a roughly 101-acre mixed-use development on the Austin side of the corridor, is bringing more than 400,000 square feet of commercial space and 400-plus multifamily units online, reinforcing why the San Marcos/Kyle submarket keeps absorbing so much new supply.
- A new 114,000-square-foot H-E-B is under construction near the San Marcos Premium Outlets, expected to open in fall 2026. It will be the city's third H-E-B and its first location east of I-35.
- In Selma, existing draws like The Forum shopping center, Retama Park, and the Amazon fulfillment center and business parks in neighboring Schertz keep the area attractive to workers who need proximity to Joint Base San Antonio-Randolph without a long commute.
None of these projects are theoretical. They're the difference between a corridor that's promised growth and one that's actively building it, and knowing which specific project sits near a given listing tells you more about that listing's five-year trajectory than the county-wide median ever will.
So Which Number Should You Actually Compare
If you're comparing homes along this corridor, the median price is the least useful number in the conversation. The comparison that actually matters has three parts: the county's effective tax rate stacked with any MUD or PID assessments on that specific parcel, the construction phase status of the exact highway segment nearest the commute you'd actually drive, and whether the submarket you're looking at is absorbing new supply the way San Marcos and Kyle are, or holding tighter the way Selma has. Two homes at the same price twelve miles apart can carry meaningfully different total costs and meaningfully different short-term outlooks, and the difference rarely shows up until someone runs the specific numbers.
Does a lower county tax rate always mean lower total cost? Not automatically. MUD and PID assessments, plus school district tax rates, stack on top of the county base rate and can offset or even reverse the county-level advantage. The county rate is a starting point for the comparison, not the final answer.
When will I-35 construction near San Antonio actually be finished? The Central segment, the piece closest to San Antonio, isn't expected to be complete until late 2027. The South and North segments are on separate, later timelines, with the North segment not yet under construction as of mid-2026. Anyone buying with an eye toward "once the highway's done" should plan around 2027 at the earliest, not sooner.
Corridor-wide numbers make for a clean headline. They don't make for a good offer. If you're weighing a specific stretch of I-35 between San Antonio and Austin and want the county-by-county, submarket-by-submarket version of this conversation, David Abrahams and the Real Estate TIES Team can walk through the tax rate, the construction phase, and the supply picture for the exact address you're considering. Book a consultation or request a free home valuation to start with your numbers instead of the corridor's average.